DNA microarray is a high-throughput technique that allows for rapid measurement and visualization of differential expression of genes at the whole genome scale. In a single microarray experiment, thousands of genes can be analysed and also permits quantitative gene expression (Figure 11.5).
The major steps involved in this process:
- Target preparation,
- Oligonucleotide probe preparation,
- Hybridization,
- Slide scanning,
- Data analysis and
- Expression profile clustering.
Figure 11.5 DNA microarray
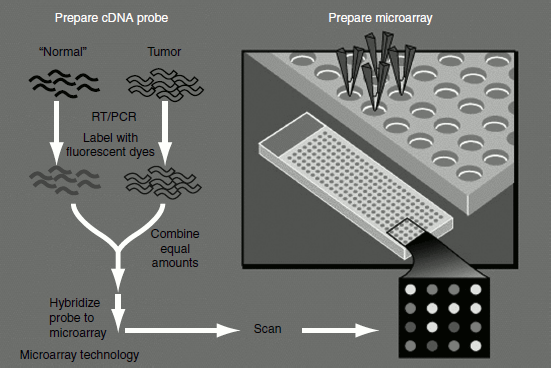
A microarray or a gene chip or a biochips is a slide attached with an array of immobilized high-density DNA oligomers (sometimes cDNAs) representing the entire genome of the species under study. Each oligomer is spotted on the slide. It serves as a probe for binding to a unique cDNA. The entire cDNA labeled with fluorescent dyes are allowed to hybridize with the oligo probes on the chip. The amount of fluorescent or radio labels at each spot reflects the amount of corresponding mRNA in the cell. Thus, expression of genes of the entire genome can be examined also genes involved in the same regulatory or metabolic pathways can be identified.
Target preparation
The cDNAs of the genes are first obtained by extracting total mRNA from tissues and cells. During the cDNA synthesis, fluorescent dyes can be incorporated in the DNA strands.
Oligonucleotide probe preparation
DNA microarrays are generated by fixing oligonucleotide onto a solid support such as glass slide using a robotic device. These oligonucleotides, which are called probes, can vary in length between 25 and 70 bp long, represent thousands of pre-selected genes from an organism. The probes hybridize to labelled cDNA. Probes designed should be highly specific, they should not cross-hybridize and should not form stable internal secondary structures. The oligonucleotide probe should be designed close to the 3′ end. All probes should have approximately same melting temperature. Their GC content should be of 45%–65%. Oligo Wiz (www.cbs.dtu.dk/services/OligoWiz) a Java program and OligoArray (http://berry.engin.umich.edu/oligoarray2/) is a Java client server program that helps to design oligonucleotide probes for microarray construction.
Hybridization
The cDNAs are made to hybridize with the oligo probes attached to the gene chip (glass slide). By differentially labelling the cDNAs with different fluorescent dyes and allowing them to hybridize to the oligo probes on the chips, the gene expression patterns of various genes can be simultaneously measured. The most common type of microarray is a two-colour microarray, which involves the labeling of one set cDNA (test) with one dye (Cy5, red fluorescence) and another set from a reference condition (controls) with the other dye (Cy3, green fluorescence).
Slide scanning
The image of the hybridized array is captured using a laser scanner. The scanner scans every spot on the microarray. Two wavelengths of laser beams are used to excite the red and green fluorescent dyes, which thus produce the red and green fluorescence. A photomultiplier tube detects the fluorescence. Thus, for each spot on the microarray, red and green signals are recorded. The two fluorescent images from the scanner are then overlaid to create a composite image which indicates the relative expression of each gene. The colour intensity is a measure of the gene expression levels. For example, if a gene is expressed at a higher level in the experimental condition (red) than in the control (green), then the spot displays a reddish colour. On the other hand, if the test gene is expressed at a lower level than the control, then the spot appears green. If both the test and control genes are expressed in equal amounts, red and green colours appear equally and thus the spot appears yellow in colour.
Data analysis
‘Image processing’ helps to locate and quatitate the spots. It also discriminates true hybridization signals from background signals contributed by non-specific hybridization, uneven slide surface and the presence of contaminants such as dust on the slide. Computer programs are used to correctly locate the spots and measure the intensities after subtracting the background pixels. The array signals are then converted into numbers and are reported as ratios between the two colours. This ratio is a measure of the gene expression changes in the experimental versus the control conditions.
Microarray scanners are normally provided with software programs to carry out microarray image analysis. There are also a number of free processing software programs available on the internet. For example, ArrayDB (www.genome.nhgri.nih.gov/arraydb/), ScanAlyze (http://rana.ibl.gov/EisenSoftware.html) and TIGR Spotfinder (http://www.tigr.org/softlab).
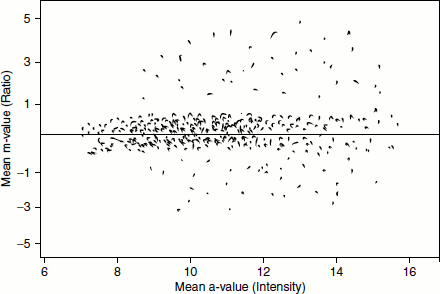
After image processing, the digitized gene expression is processed further. This processing is referred to as ‘data normalization’. This serves to correct the bias due to variations in microarray data collection rather than intrinsic biological differences. There are various ways to normalize the data. One way is to make an ‘intensity-ratio plot’ where the data is plotted horizontally (Figure 11.6). The log ratios of the Cy5/Cy3 are plotted against the average log intensities. In this way of representation, the data are distributed symmetrically about the horizontal axis. The differentially expressed genes can be visualized more easily.
A Windows program called Arrayplot (www.biologie.ens.fr/fr/geneticqu/puces/publications/arrayplot/index.html) helps in visualization, filtering and normalization of raw microarray data.
Expression profile clustering
Based on the computed distances between genes in an expression profile, genes with similar expression patterns can be grouped. This is referred as clustering. Clustering analysis helps in the identification of co-expressed and co-regulated genes. Genes that are co-regulated usually have related functions. Thus, through gene clustering, the functions of previously uncharacterized genes may be identified. Clustering is of two types namely:
Figure 11.6 Intensite-ratio plot
- Hierarchical clustering: It produces a tree-like structure that represents a hierarchy or relatedness of data groups. In the tree leaves, similar gene expression profiles are placed more closely together than dissimilar gene expression profiles. The branches of the tree pattern illustrate the relationship between the related gene groups. http://www.rana.ibl.gov/Eisensoftware.html is a Windows program capable of hierarchical clustering.
- Partitioning clustering: Example of this type of clustering is ‘k-means clustering’. In this type, the data is classified through a single partition.
Applications of Microarray Technology
Microarray technology is a powerful tool for gene profiling. It is is widely used in many areas of fundamental and applied biological researches.
- In gene expression analysis: Microarray has been widely used for the expression analysis of the genome. Thousands of gene expression patterns can be studied simultaneously.
- In mutation analysis: Point mutations/single nucleotide polymorphisms can be easily detected by microarrays by strictly regulating the hybridization conditions. Under these conditions, a single base mismatch leads to unhybridized target–probe. Thus, the abnormalities present in the genome can be detected using a microarray. Genomic DNA (e.g., from tumours and normal tissues) is cleaved using a common restriction endonuclease such as DpnII and BgIII. Adapter oligonucleotides are ligated onto the cleaved products and the DNA is subjected to PCR amplification. This sampling of the genome is a representation of the genetic configuration of an individual source (e.g., tumour) and can be compared to a similar representation from another source (e.g., normal). By quantifying the level of each PCR amplified fragments by using a microarray, deletions, insertions and alteration of the restriction sites can be determined.
- In pharmacogenomics: Pharmacogenomics is a science that combines medicine, pharmacology and genomics for developing drug therapies according to the genetic differences in patients, which is responsible for varied responses to a particular therapeutic regimen. By using microarray, the individual genetic profile of a patient can be studied and suitable therapeutic regimens can be planned.
- In disease diagnosis: Microarray helps to identify the changes in the gene expression that might contribute to the development of a disease. Thus, the technology plays a role in disease diagnosis.