In this chapter, we’ll work on daily stock price time series from 10 technology companies, including Apple, Amazon, and Intel. The data is stored in the comma-separated value (CSV) format. Here’s a sample of the Apple stock daily data:
timestamp,open,high,low,close,adjusted_close,volume,dividend_amount,split_coefficient
2018-05-14,189.0100,189.5300,187.8600,188.1500,188.1500,20364542,0.0000,1.0000
2018-05-11,189.4900,190.0600,187.4500,188.5900,188.5900,26212221,0.7300,1.0000
2018-05-10,187.7400,190.3700,187.6500,190.0400,189.3072,27989289,0.0000,1.0000
2018-05-09,186.5500,187.4000,185.2200,187.3600,186.6376,23211241,0.0000,1.0000
2018-05-08,184.9900,186.2200,183.6650,186.0500,185.3326,28402777,0.0000,1.0000
...
The columns in each CSV file are
timestamp–Date inYYYY-mm-ddformatopen–Opening price at the start of the trading dayhigh–Highest price that the stock reached during the trading daylow–Lowest price that the stock reached during the trading dayclose–Closing price at the end of the trading day (reflects the price of the last stock that was traded that day)adjusted_close–Closing price that has been retroactively adjusted for stock splits (See split coefficient below.)volume–The total number of shares traded during the daydividend_amount–The amount of dividend paid per sharesplit_coefficient–Occasionally, a stock can be split for various reasons, and the split coefficient indicates the factor by which the stock was split. Ifsplit _coefficientis 1, the stock was not split. If it’s 0.5, the stock price is halved because of the split.
For a birds-eye view of how these stocks performed since 2000, I plotted the adjusted close price against time in figure 5.1.
Most of the companies had their stock grow in the overall. We can even spot some trends. For example, IBM grew considerably from 2009 to 2012 following the growth of cloud-based technologies and expanding in that space. Nvidia (NVDA) entered a period of explosive growth in early 2016 thanks to the mass adoption of their GPUs for machine learning.
You may be wondering, why use the adjusted close and not just the closing price? Occasionally, a company splits its stock, resulting in a much different closing price than the day before. We could see this in effect in June of 2014 when Apple split its stock sevenfold:
timestamp,open,high,low,close,adjusted_close,volume,dividend_amount,split_coefficient
2014-06-09,92.7000,93.8800,91.7500,93.7000,87.1866,75414997,0.0000,7.0000
2014-06-06,649.9000,651.2600,644.4700,645.5700,85.8134,12497800,0.0000,1.0000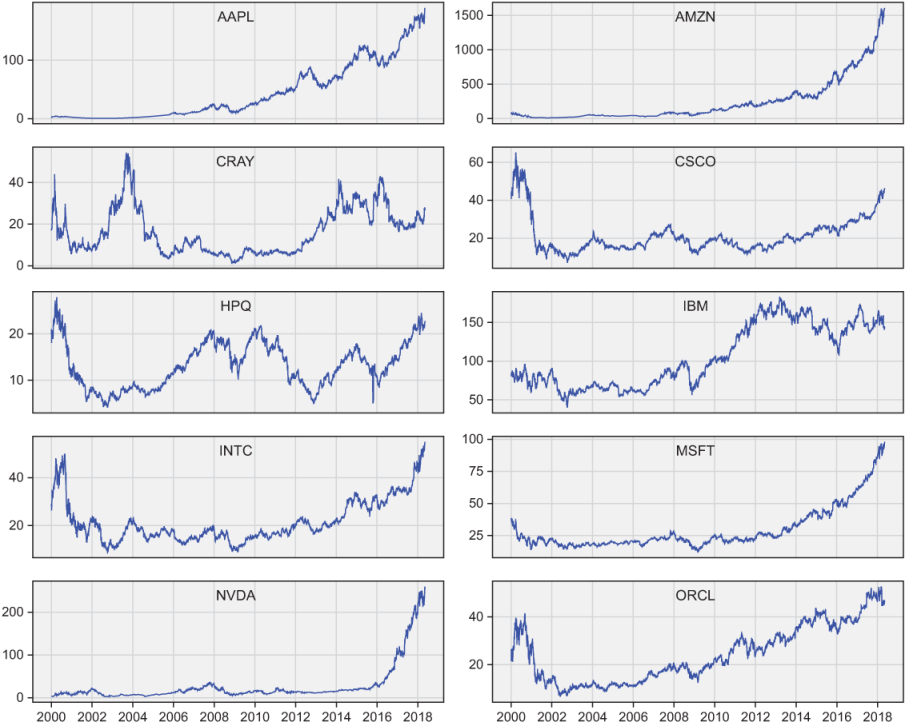
Figure 5.1 Adjusted close stock prices (USD) of 10 technology companies. The y-axis on each panel has a different scale.
On June 6, the closing price was $645.57, whereas on the next trading day, June 9 (exchange markets close on weekends), the opening price was $92.70. Notice that the split coefficient on this day is 7, indicating the factor by which the stock price was divided. If we analyzed long time series of closing prices, we’d also capture occasional large increases or drops due to events that don’t reflect the market value of the stock. Adjusted closing price retroactively accounts for all stock splits that occurred, and results in time series that are consistent with stock value. It’s thus a useful metric when analyzing the long-term historical performance of a stock.