The dataset that we’ll use in this exercise consists of hourly measurements of several weather, ocean, and wave parameters, recorded by buoys managed by the NOAA National Data Buoy Center (NDBC). One such buoy is shown in figure 7.2.
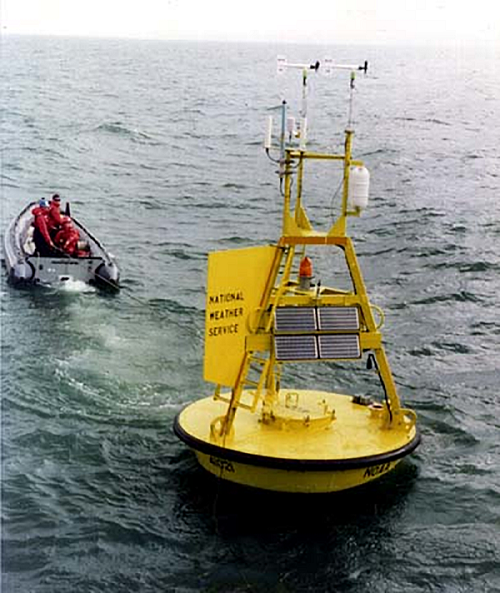
Figure 7.2 A weather and wave buoy operated by the NDBC. Instruments that measure wind, temperature, humidity, and pressure are located on the mast from top to bottom. Accelerometers inside the hull record the wave-induced motion of the buoy, which is used to derive wave height and other properties. Photograph courtesy of NDBC (http://www.ndbc.noaa.gov).
Why are these buoys so important? There are a few big reasons:
- They report real-time weather, wave, and ocean conditions and help provide guidance and safety warnings to mariners.
- The data is fed in real time into weather and ocean prediction models, making them more accurate.
- Most buoys now accrue measured data for at least a few decades. These records allow for unprecedented insights into the change of climate in the recent past.
There are hundreds of these buoys located throughout the world’s oceans, but in this exercise, we’ll focus on nine buoys located in the Gulf of Mexico (figure 7.3).
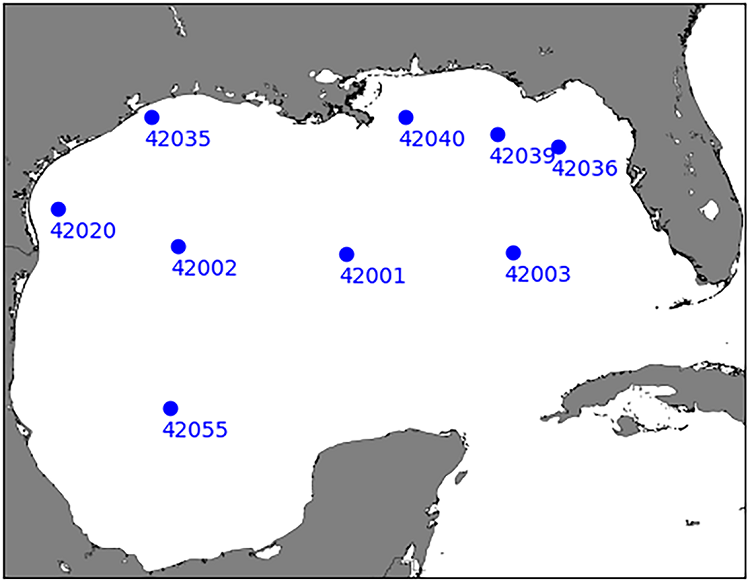
Figure 7.3 Locations of the nine weather buoys in the Gulf of Mexico used in this exercise
The dataset contains hourly measurements of wind speed, air pressure, air temperature and humidity, water temperature, and ocean wave height and period, in the comma-separated value (CSV) format, for the years 2005 through 2017. Data from each buoy are stored in their own respective file, so we have a total of nine data files, one for each buoy:
2005-01-01_00:00:00,  9.4, 1020.9, 24.2, 20.5, 24.6,   2.22,   6.11
2005-01-01_01:00:00,  8.6, 1021.5, 24.0, 20.6, 24.5,   2.41,   6.44
2005-01-01_02:00:00,  7.3, 1021.8, 24.3, 20.9, 24.5,   2.16,   5.97
2005-01-01_03:00:00,  7.6, 1022.0, 24.5, 20.6, 24.5,   2.26,   6.38
2005-01-01_04:00:00,  7.8, 1022.4, 24.6, 20.1, 24.5,   2.03,   5.98
...
This is a sample of weather data that we’ll use in this exercise. From left to right, the columns are: Timestamp (UTC), wind speed (m/s), pressure (mbar), air temperature (deg. C), dew point (deg. C), water temperature (deg. C), wave height (m), and wave period (s).
To give you an idea of what the data look like through time, I plotted the wind speed measured by buoy 42002 during January of 2017 in figure 7.4. The peaks on January 8 and January 24 are associated with the passage of cold fronts through the Gulf of Mexico, much like the one that we used in exercises in chapters 2 and 3. This is also just a small subset of the data. The full dataset for this exercise contains 13 years of hourly measurements of several weather, ocean, and wave parameters, for each of the nine buoys. I use 13 years here to keep the problem small enough. However, if you’re feeling adventurous, I encourage you to explore longer time series and process more buoys available from NDBC. Some of the buoy measurements go as far back as the early 1970s!
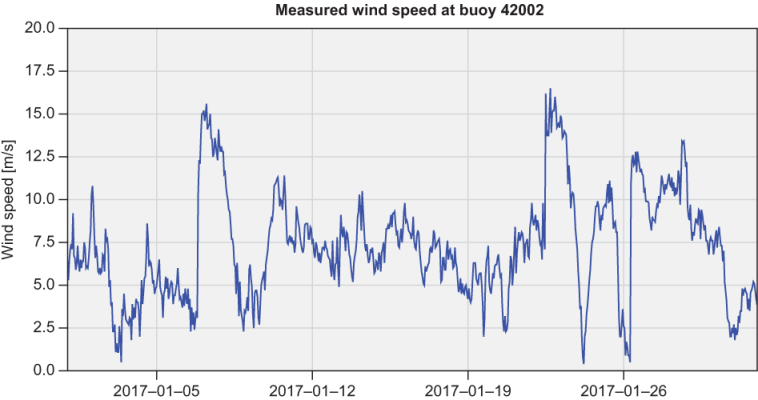
Figure 7.4 Time series of wind speed measurements at buoy 42002 during January of 2017