The dataset that we’ll work in this chapter is based on weather data collected at automated ground stations all over the world and gathered every hour to a central database. The specific weather parameters, their units, and their data types are summarized in table 9.1.
Table 9.1 Variables and their units and data types in the weather dataset
| Column | Variable | Units | Data type | Example value |
|---|---|---|---|---|
| 1 | Temperature | Fahrenheit | real | 57.9 |
| 2 | Humidity | % | real | 93.0 |
| 3 | Wind speed | Knots | integer | 10 |
| 4 | Clear sky | None | logical | False |
The key factor here is that the dataset consists of three different data types: integer, real, and logical. Don’t worry about the specific units–since we’ll be looking for minimum and maximum values of the averages, the units are irrelevant for the analysis.
Here’s a sample of the post-processed data that we’ll be working with–the first 10 lines of a post-processed data file for London Heathrow:
head data/processed/EGLL.csv     ❶
44.6,81.2,16,True
44.6,75.68,16,True
44.6,75.68,14,True
42.8,81.07,13,True
44.6,75.68,17,True
42.8,75.5,12,True
42.8,75.5,11,True
42.8,81.07,12,False
42.8,75.5,13,False
42.8,75.5,9,True
❶ Lists first 10 lines of a file
Here I used the Linux utility head to print the first 10 columns of the data file EGLL.csv. EGLL is the international airport code for Heathrow Airport in London, England. This data is significantly reduced from its original content to minimize the data volume in the source code repository. If you’re interested in seeing what the complete dataset looks like, type make download from the data directory.
In this exercise, we’ll work with the weather data for the year 2018. If you want to apply this code to a larger dataset, or data from a different year, you can use the scripts included in the repo to get more data.
If you want to download the whole source code to follow along as you read the chapter, you can do so by cloning the repository from GitHub:
git clone https://github.com/modern-fortran/generic-proceduresThe repository also includes the sample data we’ll use in this exercise, as well as scripts to download more data; for example, for different cities and/or time periods.
An example plot of temperature, humidity, and wind speed measured at the Miami International Airport is shown in figure 9.1.
There’s a lot of data in this figure–one data point for every five minutes for wind speed, and every hour for temperature and humidity. In this chapter, we’ll crunch all of it for 10 different cities around the world. Most of these are from airport weather stations, local or international, but some automated weather stations could be located in city parks or in the countryside.
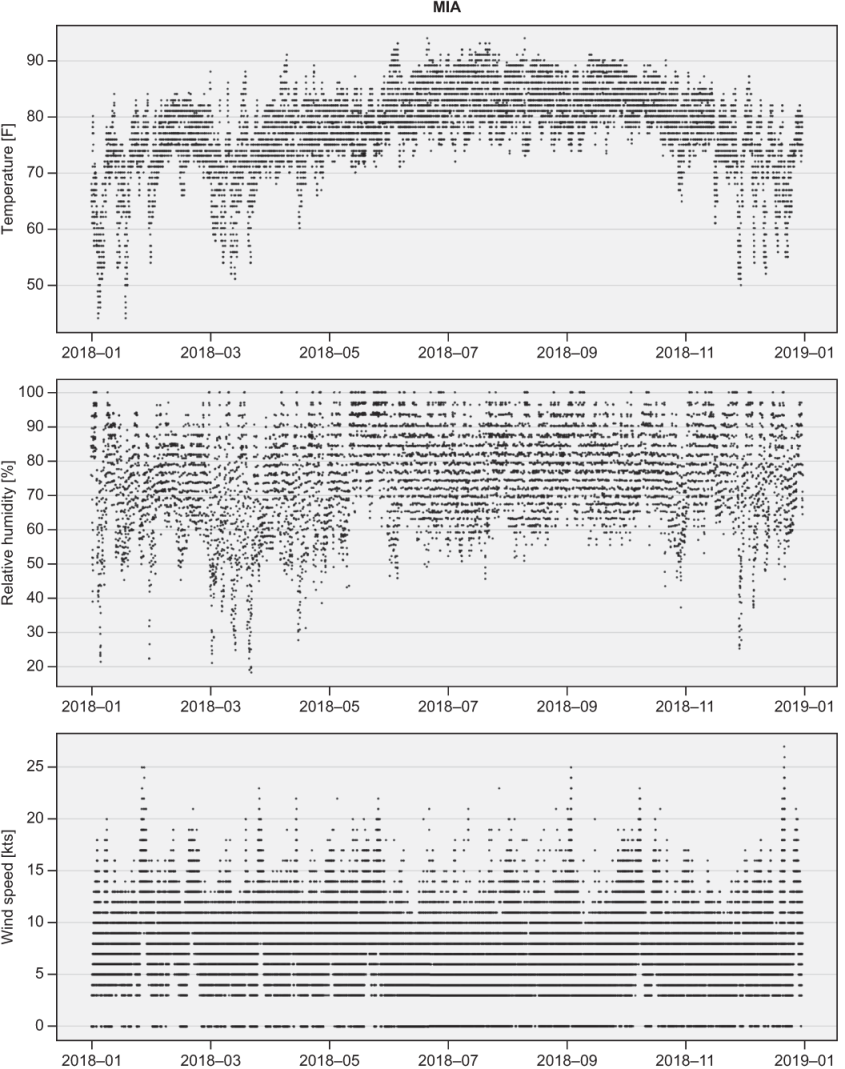
Figure 9.1 Measurements of temperature, relative humidity, and wind speed at the Miami International Airport in 2018